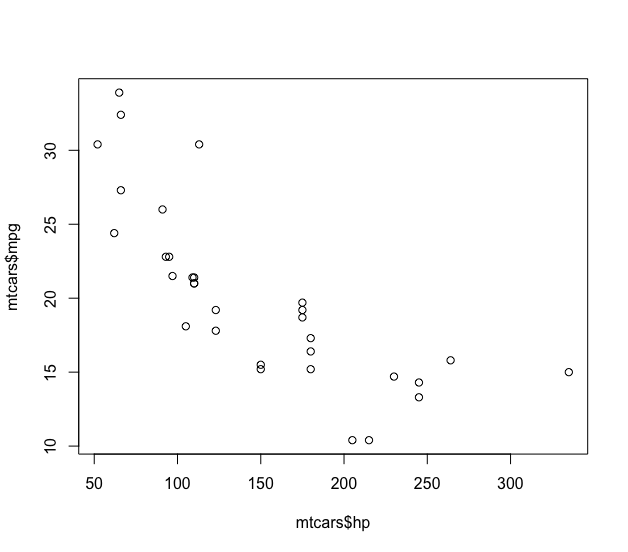
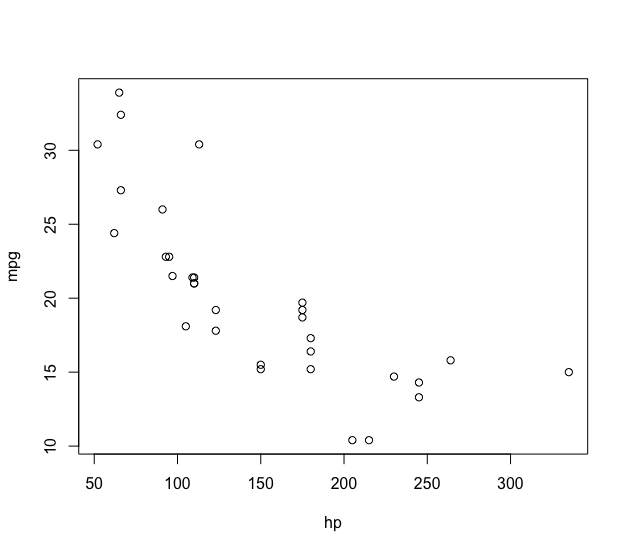
Once you've created a slide and added some content to it, you may want to add some simple animations to control the order in which items appear. The order that the animation appears depends on the number specified in the two sets of curly braces. In the example shown, we bring the code in first, and then the plot in second. We can also reverse this to bring the code in second, and the plot in first.
Another example you may encounter is if you'd like multiple slide elements to appear together at the same time. For example, let's say you'd like an image and code chunk to come in together, then another image and code chunk to come in together after that. You can do something like this:
Part 1:
{{1}}
```r
plot(mtcars$hp, mtcars$mpg)
```{{1}}Part 2:
{{2}}
```r
plot(mpg ~ hp, data = mtcars)
```{{2}}Both elements in part 1 would appear together, followed by both elements in part 2.

